A swap receipt says status: 0x0, but it does not identify the inner call that reverted. debug_traceTransaction re-executes the transaction and can return that call's error and revert data.
A production trace depends on retained state, client support, and a timeout long enough for replay. Provider billing can also weight it above an ordinary read. This guide shows when to request a trace, when to use a receipt, and how to handle a trace failure.
debug_traceTransaction vs the trace namespace
Ethereum clients expose two tracing APIs. The debug namespace follows Geth. The trace namespace follows the older OpenEthereum (Parity) format. They answer similar questions but return different shapes.
| Client | debug_traceTransaction | trace_transaction and trace_replayTransaction |
|---|---|---|
| Geth | Yes. Default tracer is the struct (opcode) logger | Not provided |
| Erigon | Yes | Yes, flat OpenEthereum-compatible output |
| Nethermind | Yes | Yes |
| Reth | Yes | Yes |
Sources: Geth debug namespace, Erigon trace, Erigon debug, Nethermind trace, Nethermind debug, Reth trace, and Reth debug.
If your tooling calls trace_transaction and a provider routes the request to a Geth-based node, the method is missing. Record the client and namespace for every endpoint in your failover list, not just the chain.
The output shape depends on the tracer
debug_traceTransaction returns whatever the selected tracer produces. Geth's built-in tracers cover the common cases:
| Tracer | What you get | Use it for |
|---|---|---|
| None (struct logger) | A structLogs array with one entry per executed opcode: pc, op, gas, gasCost, depth, stack, and storage | Opcode-level debugging only |
callTracer | A nested tree of call frames with type, from, to, value, gas, gasUsed, input, output, error, revertReason, and child calls | Support escalations and failed-trade triage |
prestateTracer | Every account the transaction touched, or pre and post objects with diffMode: true | Explaining why execution differed from a simulation |
The trace namespace returns a flat list instead of a tree. Each entry in trace_transaction carries an action, a result or error, a subtraces count, and a traceAddress array that locates the frame in the call tree. trace_replayTransaction takes a list of trace types (trace, stateDiff, vmTrace) and returns an object with output, trace, stateDiff, and vmTrace fields.
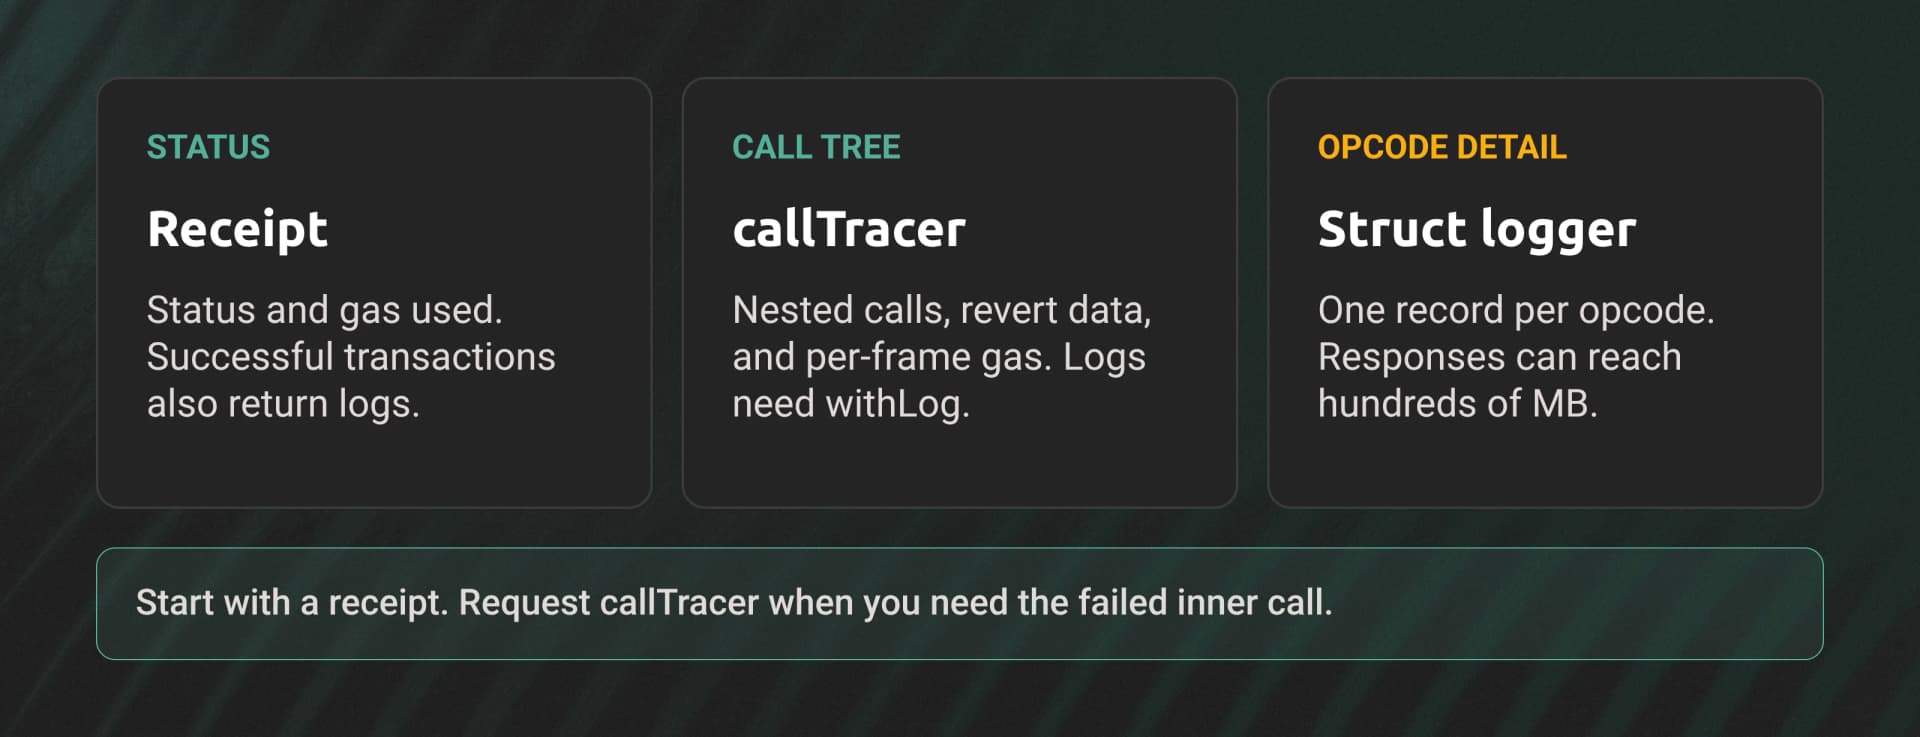
For most escalations, request the call tree explicitly and set a timeout:
{
  "jsonrpc": "2.0",
  "id": 1,
  "method": "debug_traceTransaction",
  "params": [
    "0xYOUR_TX_HASH",
    { "tracer": "callTracer", "tracerConfig": { "withLog": true }, "timeout": "10s" }
  ]
}
withLog: true attaches emitted logs to the frame that emitted them. If your tooling supports both namespaces, normalize to one internal shape at the edge. Converting traceAddress paths into a tree is a small function, and it keeps the rest of your tooling on one parser.
What a full node can trace
Tracing re-executes the transaction. The node needs the state at the parent block, and it replays every earlier transaction in the same block first. Geth's tracing guide lists the inputs: balances, nonces, code, and storage for every contract touched, plus block metadata and the intermediate state from preceding transactions.
A full node keeps recent state and prunes the rest. The traceable window depends on the client and storage mode:
| Node | Traceable window | Error outside the window |
|---|---|---|
| Geth full node, path scheme | The latest 128 blocks, about 25.6 minutes at 12-second blocks | historical state is not available |
| Geth full node, hash scheme | The latest 128 blocks, plus older blocks within 128 blocks of a stored checkpoint | required historical state unavailable (reexec=128) |
Geth path archive (--gcmode archive) | Indexed history retained by --history.state (0 keeps all) | Same as path scheme, until indexing completes |
| Erigon, not archive mode | trace_replayTransaction for transactions in the most recent 1,000 blocks | Replay fails for older transactions |
Reth --full | The last 10,064 blocks for debug_trace* and trace_* | Pruned history is unavailable |
| Archive node with retained state | Historical transactions within its retained range | Missing state or provider limits can still block a trace |
Sources: Geth sync modes, Geth archive mode, Geth v1.17.6 state accessor, Erigon trace, and Reth pruning.
Geth uses the path scheme by default for new databases. A path-based full node keeps one persisted state 128 blocks behind the head and holds newer diffs in memory. It also keeps reverse diffs for 90,000 blocks by default, but those support rollbacks. Geth serves historical state from them only after you enable archive indexing with --gcmode archive.
On chains with 2-second blocks, 128 blocks covers about 4 minutes and 16 seconds. A support ticket opened an hour after the failure is outside that window on a default Geth full node.
The same limit affects state reads. eth_call, eth_getBalance, and eth_getStorageAt against an old block on a full node return missing trie node, usually as JSON-RPC error -32000. If a trace and an eth_call against the same block both fail, the node is missing state. Your request is fine.
reexec is not a history switch
The Geth debug namespace documents a reexec field with a default of 128: how many blocks the tracer may walk back and re-execute to rebuild missing state. It only applies to hash-scheme nodes, which regenerate state from older checkpoints. It cannot help a path-scheme node, which has no checkpoints to replay from.
In the Geth v1.17.6 tracer API, TraceConfig no longer has a reexec field. The 128-block walk is a fixed internal limit for hash-scheme nodes. Other clients and Geth forks may still accept the field, so check your client version. For current Geth, route old transactions to an archive endpoint instead of raising reexec.
The hidden cost of archive nodes covers the storage and provider trade-offs of archive access. Dwellir's Ethereum debug_traceTransaction reference describes the method as requiring an archive node.
Output size, timeouts, and provider pricing
A trace costs more than a simple read in three ways: response size, execution time, and billing weight.
Always name the tracer
If you omit tracer, Geth uses the struct logger and emits one entry per opcode. Stack and storage capture are on by default, memory capture is off, and limit defaults to 0 (no limit). Geth's documentation warns that a full opcode trace can reach hundreds of megabytes.
For support tooling, send callTracer. If you only need the outer call's result and gas, add onlyTopCall: true. Enable enableMemory or enableReturnData only for a one-off debugging session.
Set the timeout on purpose
Geth applies a default timeout of 5 seconds to each transaction trace and returns execution timeout when it expires. The timeout field accepts a Go duration string such as "10s". The node also replays the earlier transactions in the block before the trace starts, so set your HTTP client deadline above the trace timeout.
Treat a trace timeout as its own outcome, separate from missing state. Optionally retry once with a longer timeout before you apply your fallback policy; the classifier below goes straight to that policy. Avoid putting many traces in one JSON-RPC batch: one slow trace delays the whole response. The batch sizing guide covers per-ID error handling if you batch anyway.
What providers charge per trace
Published method weights as of 25 September 2026:
| Provider | debug_traceTransaction | trace_transaction | trace_replayTransaction | eth_call | Free plan |
|---|---|---|---|---|---|
| Alchemy | 40 CU (1,000 throughput CU) | 40 CU | 80 CU (3,000 throughput CU) | 26 CU | Not included |
| QuickNode (Ethereum) | 40 credits | 40 credits | 80 credits | 20 credits | Not included |
| Infura | 1,000 credits | 300 credits | Not listed | 80 credits | Not included; from Developer ($50/month) |
| Chainstack Global Node | 2 RUs | 2 RUs | 2 RUs | 1 RU for recent blocks | Paid plans only |
| Dwellir | 1 API credit | 1 API credit | 1 API credit | 1 API credit | Paid plans only |
Sources: Alchemy compute unit costs, Alchemy pricing, QuickNode Ethereum API credits, QuickNode pricing, Infura credit costs, Infura pricing, Chainstack request units, Chainstack debug and trace APIs, and Dwellir pricing.
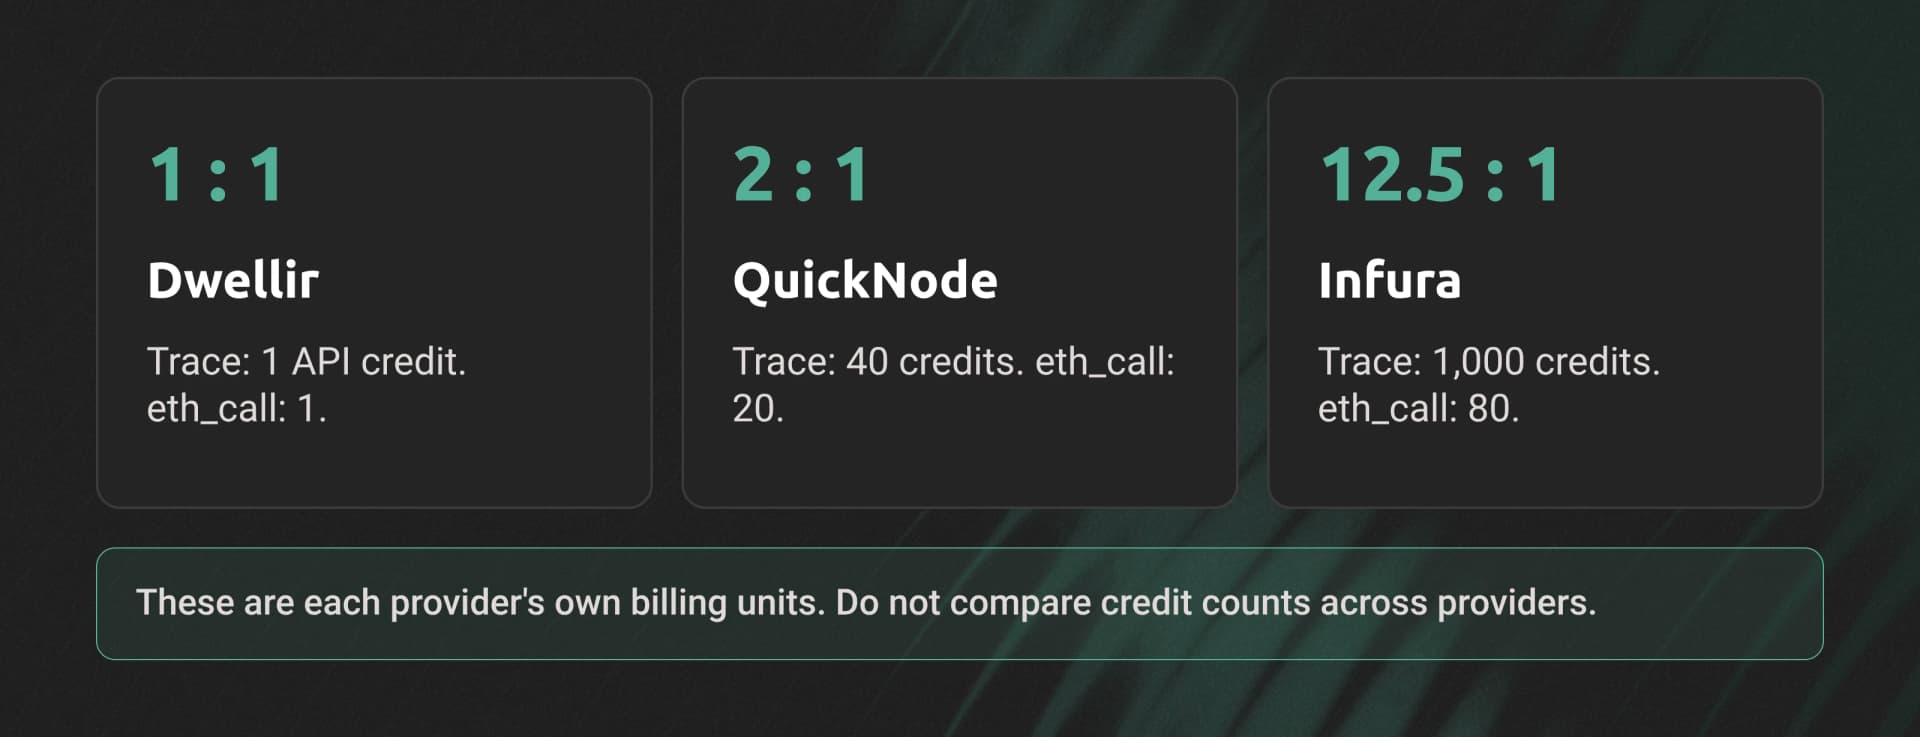
QuickNode's figures apply its published multipliers to the 20-credit Ethereum base: 2x for trace and debug methods, 4x for trace_replayTransaction.
Rate limits hit traces sooner than bills. Alchemy counts throughput CU against a per-second limit, and Pay As You Go starts at 10,000 CU/s. At 1,000 throughput CU per call, that is 10 debug_traceTransaction calls per second, or about 384 eth_call requests at 26 CU. Alchemy notes that applications can burst beyond their reserved throughput.
Infura's Developer plan includes 15 million credits per day and 4,000 credits per second of guaranteed throughput. At 1,000 credits per trace, that is 4 traces per second and 15,000 traces per day if you make no other calls.
Dwellir counts a trace as one response against the plan's response-per-second limit. The Developer plan includes 25 million responses and 100 responses per second for $49 per month. Trace and debug methods are available on all paid plans.
Failed calls can also be billed. Alchemy charges the method's CU for 4xx and 5xx errors other than 429 and 403. Infura does not charge for 5xx errors and charges 5 credits for 4xx errors. QuickNode applies multipliers to valid 200-status responses. A timeout reported as a JSON-RPC error inside an HTTP 200 response is a separate case, so check how your provider meters it before you add automatic retries.
How this differs from eth_call pricing
The eth_call pricing benchmark converts one common method into cost per million calls across providers. Use it for your baseline. Traces change the ratio between providers:
| Provider | Trace weight vs eth_call |
|---|---|
| Alchemy | 40 / 26 CU, about 1.5x the bill; 1,000 / 26 throughput CU, about 38x the rate-limit weight |
| QuickNode (Ethereum) | 40 / 20 credits, 2x |
| Infura | 1,000 / 80 credits, 12.5x |
| Chainstack Global Node | 2 / 1 RU, 2x |
| Dwellir | 1 / 1 credit, 1x |
To estimate a trace-heavy workload, apply the eth_call model to your read volume, then multiply the trace volume by the ratio for your provider.
Fail closed or fall back to receipts
When a trace fails, you can fail closed and return no answer, or fall back to eth_getTransactionReceipt and eth_getLogs. The right choice depends on what the answer drives.
The receipt gives you status, gasUsed, and effectiveGasPrice. Successful transactions also include emitted logs. A failed transaction discards its logs. Gas use alone cannot tell you which call failed or why.
eth_getLogs for the transaction's block can show events from earlier transactions. Those events may help explain why the included result differed from a simulation. They do not prove which state change caused the difference.
What you lose without a trace:
- Internal calls and internal ETH transfers
- Which frame reverted, and the raw revert data from inner frames
- Per-frame gas usage
- The state diff the transaction produced
- Logs from frames that reverted, because a revert discards them
In Geth v1.17.6, callTracer fills revertReason on any reverted frame when the revert data is a standard Error(string) or Panic(uint256). Custom errors stay as raw bytes in output, so decode them against the contract ABI.
| Workflow | Policy on trace failure |
|---|---|
| Customer-facing "why did my transaction fail" answer | Fall back to receipt and logs. Label the answer as partial. |
| Internal ticket triage | Fall back, then queue the trace for an archive endpoint. |
| Post-trade reconciliation of simulated vs included fills | Fail closed. Retry on archive or escalate. |
| Refund, compensation, or liability decisions | Fail closed. Do not decide from a receipt alone. |
| Status dashboards | Receipt only. Skip the trace. |
For the reconciliation case, compare the actual execution with your simulation. Run prestateTracer with diffMode: true on the included transaction. Then run debug_traceCall with the same call against the parent block, the state your simulation used. Geth's debug_traceCall also accepts a txIndex to trace against the state at a given position in a block.
A minimal classifier for support tooling:
const RPC_URL = process.env.RPC_URL;

async function rpc(method, params) {
  const res = await fetch(RPC_URL, {
    method: 'POST',
    headers: { 'content-type': 'application/json' },
    body: JSON.stringify({ jsonrpc: '2.0', id: 1, method, params }),
    signal: AbortSignal.timeout(15_000), // above the 10s trace timeout
  });
  // HTTP 429: stop before JSON-RPC handling so we never call fallback methods.
  if (res.status === 429) {
    const err = new Error('HTTP 429');
    err.code = 429;
    throw err;
  }
  let body = null;
  try {
    body = JSON.parse(await res.text());
  } catch {
    // Non-JSON body from other error pages
  }
  if (body?.error) {
    const err = new Error(body.error.message);
    err.code = body.error.code;
    throw err;
  }
  if (!res.ok || !body) {
    const err = new Error(`HTTP ${res.status}`);
    err.code = res.status;
    throw err;
  }
  return body.result;
}

function classify(err) {
  const msg = String(err.message).toLowerCase();
  if (err.code === 429) return 'rate_limited';
  if (msg.includes('historical state') || msg.includes('missing trie node')) return 'state_unavailable';
  if (msg.includes('timeout')) return 'timeout';
  if (msg.includes('method not found') || err.code === -32601) return 'method_missing';
  return 'other';
}

export async function explainFailure(txHash, { failClosed = false } = {}) {
  try {
    const trace = await rpc('debug_traceTransaction', [
      txHash,
      { tracer: 'callTracer', tracerConfig: { withLog: true }, timeout: '10s' },
    ]);
    return { complete: true, trace };
  } catch (err) {
    const reason = classify(err);
    if (reason === 'rate_limited') return { complete: false, reason, action: 'retry_later' };
    if (failClosed) return { complete: false, reason, action: 'retry_on_archive' };

    try {
      const receipt = await rpc('eth_getTransactionReceipt', [txHash]);
      // null means pending or unknown to this node, not proof the tx does not exist
      if (!receipt) return { complete: false, reason, action: 'pending_or_not_found' };
      const addresses = [
        ...new Set([receipt.to, ...receipt.logs.map((log) => log.address)].filter(Boolean)),
      ];
      const blockLogs = addresses.length
        ? await rpc('eth_getLogs', [{ blockHash: receipt.blockHash, address: addresses }])
        : [];
      const txIndex = Number(receipt.transactionIndex);
      const earlierTxLogs = blockLogs.filter((log) => Number(log.transactionIndex) < txIndex);

      return {
        complete: false,
        reason,
        status: receipt.status,
        gasUsed: receipt.gasUsed,
        txLogs: receipt.logs,
        earlierTxLogs,
      };
    } catch (fallbackErr) {
      return { complete: false, reason, action: 'endpoint_unavailable', error: fallbackErr.message };
    }
  }
}
The classify strings match the Geth errors above. Other clients word these errors differently, so log unmatched messages and extend the list. The 15-second request deadline sits above the trace timeout, so a stalled connection still returns a result instead of hanging. A 429 returns early, because calling more methods on a rate-limited endpoint makes the backlog worse. A null receipt means the transaction is still pending or unknown to that node, so the example reports pending_or_not_found rather than a definite miss. The receipt path returns complete: false every time, so your UI and downstream jobs can tell a partial answer from a full one.
Before you ship
Record the client and namespace behind every endpoint. Send callTracer explicitly and set timeout. Route transactions older than your full node's window to an archive endpoint instead of raising reexec. Cache trace results by transaction hash and tracer config only after the block is final, because a chain reorg can move the transaction. Decide per workflow whether a missing trace means a partial answer or no answer.
Dwellir bills debug_traceTransaction, trace_transaction, and trace_replayTransaction as one API credit each, on the same plans as ordinary reads. Compare allowances on the pricing page, or create an account and run your trace mix against a paid endpoint.